Run Prometheus and Grafana with Spring boot Actuator
20 Aug 2023Monitoring System Diagram
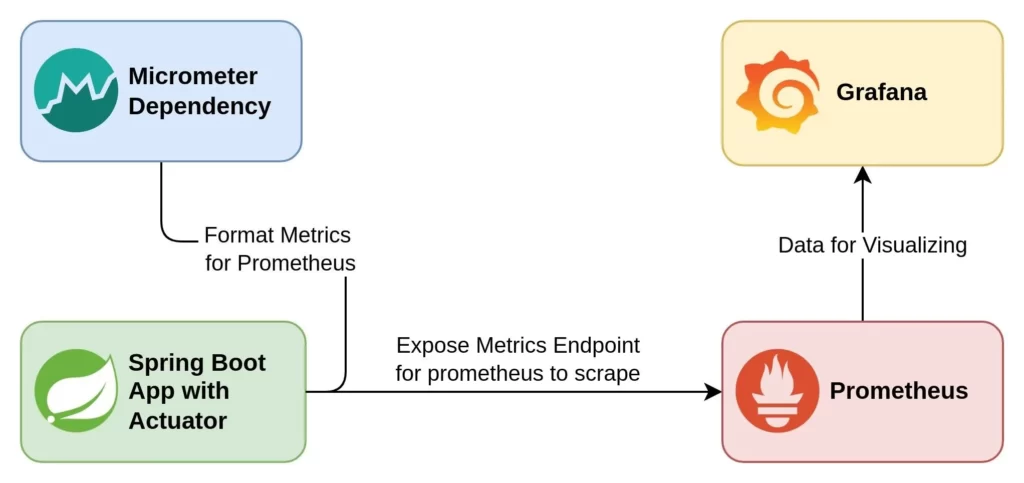
So what is All of that?
- First we added Spring Boot Actuator dependency to our project, Actuator brings production-ready features to our application. Monitoring our app, gathering metrics, understanding traffic, or the state of our database become trivial with this dependency.
 <dependency>
    <groupId>org.springframework.boot</groupId>
    <artifactId>spring-boot-starter-actuator</artifactId>
</dependency>- Then, we added micrometer dependency, Micrometer is a metrics instrumentation library powering the delivery of application metrics from Spring Boot applications. Micrometer provides a simple facade over the instrumentation clients for the most popular monitoring systems like Prometheus. As an instrumentation facade, Micrometer allows you to instrument your code with dimensional metrics with a vendor-neutral interface and decide on the monitoring system as a last step.
	<dependency>
		<groupId>io.micrometer</groupId>
		<artifactId>micrometer-registry-prometheus</artifactId>
</dependency> - After that, we configured our Prometheus server to scrape our metrics that are exposed by the actuator, Prometheus is an open-source systems monitoring and alerting toolkit. Prometheus collects and stores its metrics as time series data, i.e. metrics information is stored with the timestamp at which it was recorded, alongside optional key-value pairs called labels, the collection happens via a pull model over HTTP.
- Finally, we configured our Grafana, Grafana allows you to query, visualize, alert on and understand your metrics no matter where they are stored. Create, explore, and share beautiful dashboards with your team and foster a data driven culture.